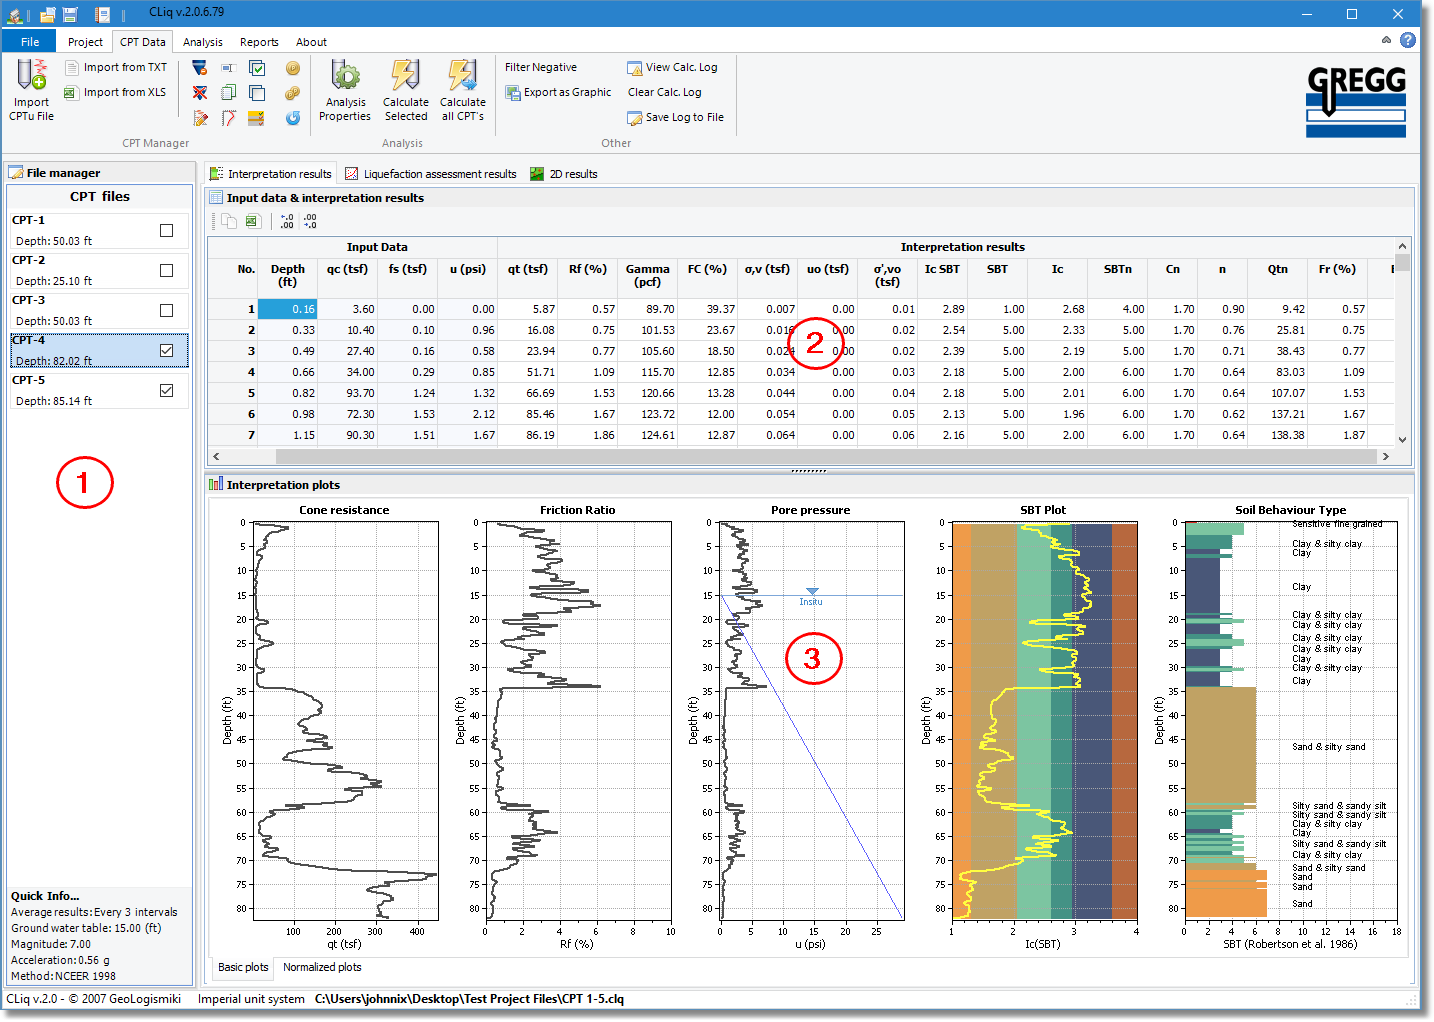
The software's main window is divided into two areas. In the left area, under the title File manager (marked as "1" in the figure below), it displays a list with the available CPTU data for the current working project. Inside the right area CLiq will display input and calculation results in both tabular and graphic format. This way you can always have an instant preview of your data and liquefaction assessment results for quick reference.

CLiq main window
The right hand side of the main window shows tabular output in the top half (marked as "2" in the figure above) and plots in the lower half (marked as "3" in the figure above). The top half has three (3) tabs, one for Interpretation Results, one for Liquefaction assessment results and one for the presentation of 2D results. A short description of what these tabs show is presented below:
![]()
When the Interpretation results tab is activated, the table shows the measured CPT input data and basic interpretation results as a function of depth. The lower half shows the various plots in two tabs.
Basic plots: This tab displays plots of the corrected cone resistance, qt, friction ratio, Rf, penetration pore pressure, u (with reference hydrostatic profile based on user input GWT), normalized SBTn Ic, and non-normalized SBT.
Normalized Plots: This window displays plots of normalized CPT parameters, normalized tip resistance, Qtn, normalized friction ratio, Fr, normalized pore pressure parameter, Bq, normalized SBTn Ic and normalized SBTn.
![]()
When the Liquefaction assessment results tab is activated, the table shows input data and calculation results as a function of depth. The lower half shows the various plots in three tabs.
Intermediate results: This tab displays plots regarding the steps needed to calculate the clean sand equivalent normalized cone resistance (needed for the CRR7.50 calculation).
Cyclic Liquefaction Plots: This tab presents the summary of the calculation procedure by presenting plot of the Cyclic Stress Ratio (CSR), Cyclic Resistance Ratio (CRR), Factor of Safety, Liquefaction Potential Index and estimated displacements (vertical and lateral) over depth.
Analysis summary: This tab presents an overall summary of the liquefaction assessment, in terms of the normalized SBTn and the plot of CSR versus clean sand equivalent normalized cone resistance with each CPT data point displayed.
Check for strength loss: This tab presents a summary related to "Flow Liquefaction" and the resulting "liquefied strength ratio", depending on the method selected by the user.
![]()
This tab contains all the necessary commands to create and print 2D results for the LPI or vertical settlements.