Since the cone tip physically is located at a distance below the center of the cone sleeve, the depth of a tip measurement is normally ahead from the sleeve measurement. The software uses the cross correlation function to analyze the relative position of qc and fs and proposes a shift value so that the two readings will "match".

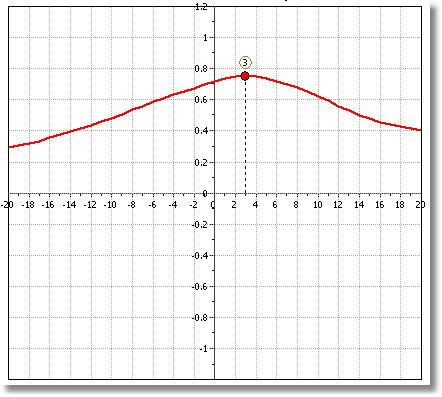
Cross correlation plot
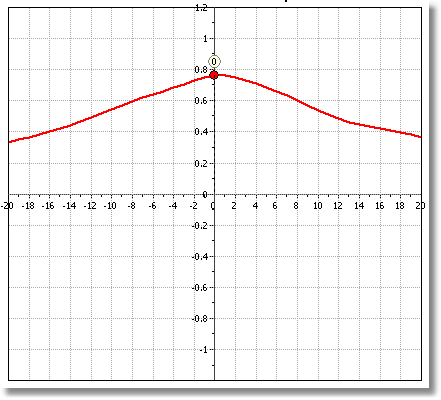
At the Raw Data Plots section the cross correlation displays a red dot with a number above it. When the value of the number is different than zero (0) then data need some processing. This value represents the lag number that is the interval steps needed to shift fs relative to qc (the interval step is defined as the distance between two successive CPT data readings). So, if the step interval is 0.05 cm and the lag number is 3 this means that the software estimates a relative shift of 15 centimeters. To apply the filter click on the cross correlate command and allow the software to proceed.

Cross correlation plot after the filter is applied