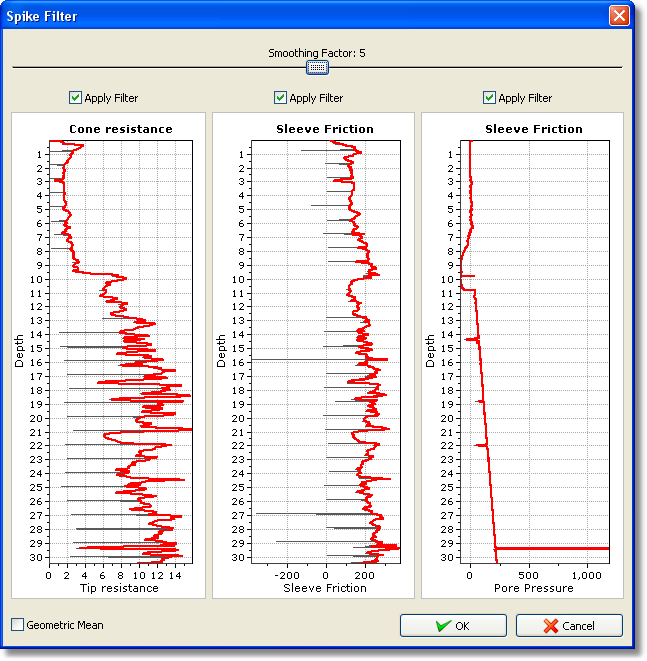
During rod changing or when stopping for a dissipation test, qc and fs readings drop instantly and this results to spikes that can easily be removed using the spike filter. The filter dialog looks like the following:

Spike filter dialog
The red plot lines present the filtered values and the dark gray lines are the original raw values. The smoothing factor represents the nu,ber of times the filter will apply to the selected raw data (the Apply Filter check boxes should be checked in order for the filter to apply to the corresponding raw data).

Filtered data preview
Filtered values are calculated based on the average values, by default the arithmetic mean is used but the geometric mean can be used if the Geometric Mean check box is checked.