By default, when importing CPTU data, all plots use an auto scale feature to fit the data in both vertical and horizontal axes. CPeT-IT allows you to modify the scale of the axes by setting custom minimum and maximum display values. Consider the raw input plots below:

Sample raw data plots
In order to customize the vertical axis just click on anyone of them. The following dialog appears:

Axis scale customization dialog
The dialog will display the current axis scaling values, which are set to Automatic by default. You may alter the minimum and maximum values that the axis can display by entering data on the Min value and Max value edit boxes. Entering a custom value in the Desired increment area the plot will try to display a label using this value as a step. For example you may need to display the depth value every one meter so just enter 1.00 into the associated edit box. The Number of minor ticks should be an integer value which denotes the number of minor ticks between two depth increments.
Since the vertical axis displays a common variable for all graphs (depth) checking the Apply to all plots checkbox will instruct the software to apply all changes made to all plots, except the SBT charts. This feature is only available when editing a vertical axes.
In a same manner you can alter the properties for the horizontal axis of each plot, making them look like:

Sample raw plots with custom axes properties

All the above made changes apply only to the current selected CPTU file. In order to apply the scales defined in one CPTU file to all CPTU files in the current project you must double click inside any plot. The following dialog will appear:
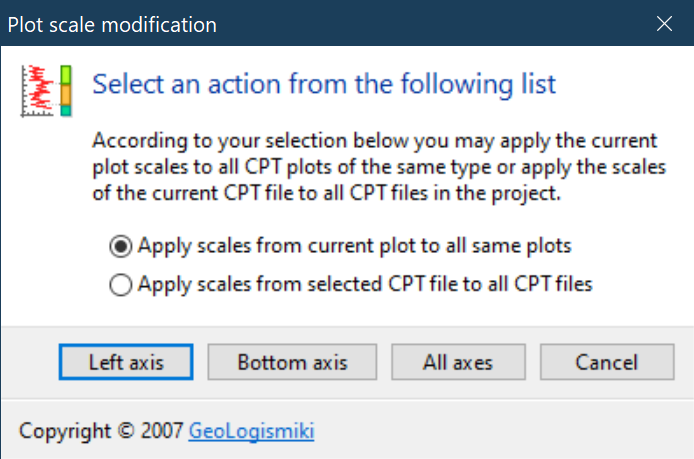
According to your selection you may apply the current plot scales (only for the plot where you double clicked) to all plots of the same type for all CPTU files or transfer the plot scales from all graphs in the selected CPTU file to all other plots for all CPTU files in the current project. You may also apply changes only for the left axes or bottom axes or all axes.