If a dissipation test has been carried out, the dissipation test results can be plotted and a value for the coefficient of consolidation in the horizontal direction, ch, can be calculated. The 'Dissipation data module' can be activated by clicking on the  button located on the main toolbar. The following dialog will appear.

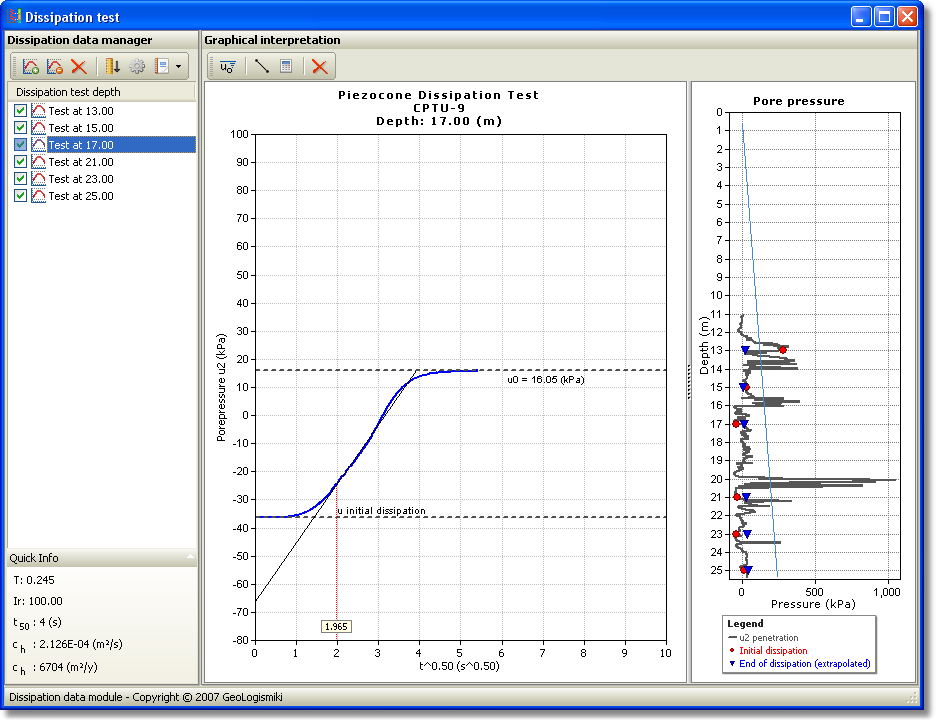
Dissipation module window
The Dissipation data manager will display any previously saved dissipation tests. If you need to import a new test press the  on the toolbar.
The calculation of ch requires the time for 50% dissipation, t50, i.e. the time for 50% of the excess pore pressure to dissipate. The dissipation results are presented on a plot of pore pressure versus square root of time. The plot will also display the calculated equilibrium pore pressure based on the user input ground water level (GWL). Houlsby and Teh (1988) showed that the theoretical dissipation on a square root time plot should have an initial linear portion then level off to the final equilibrium value. If the dissipation test has been carried out to equilibrium (i.e. 100% dissipation), the user can check the final equilibrium value against the assumed hydrostatic value calculated based on the user input GWL.
The user can use the  button to input a line over the linear portion of the measured data, then when the calculation button is clicked (
 ) the linear line is extended from time zero to the input equilibrium pore pressure and the t50 value calculated. The calculation of ch requires a value for the rigidity index of the soil, Ir. The rigidity index is the equivalent elastic stiffness normalized to undrained shear strength, (Ir = G/Su). The user can input or select the appropriate value for Ir by clicking on the calculation properties
  button.

Calculation parameters dialog
If the CPT indicates that the soil at the depth of the dissipation test is clay (i.e. SBTn of either 1, 2, 3, 4 or 9, see Note) the user can select Ir based on either the estimated values of small strain Go and Su from the CPT file or a user input value for Ir. The calculation properties dialog box also allows the user to modify the input GWL. Ir values typically vary from 100 to 500, with the higher values linked to low plasticity clays. If the soil is clay and there are estimated values for Go and Su, the calculated value for Ir maybe too large since the stiffness used is the small strain stiffness, Go. However, the calculated values are provided as a guide.
The value of u0 can also be entered manually by clicking and dragging the line plot on the chart or by clicking on the u0 button on the toolbar. The user can check the initial and final pore pressures in the Pore pressure plot at the right of the dissipation dialog and make decide for any adjustments in these values.

Calculation results in dissipation module dialog
The calculated value for ch is shown in the lower left portion of the Dissipation Test dialog box, along with the theoretical time factor, T, the selected Ir and the calculated t50 from the dissipation test.
The user should ensure that the correct cone radius was provided in the general Calculation Properties dialog box, on the main window.